With many plants preparing for planned outages, one question becomes critical. What actually needs attention?

Motors, pumps, gearboxes and conveyors may all be running, but that does not mean they are in good condition. Acting on assumptions can lead to unnecessary work, missed faults, or failures shortly after restart.
This is where condition monitoring, and more specifically spectral vibration analysis, provides clarity. The combination of Dynamox sensors and Dynamox web-based software platform make spectral analysis easy and comprehensive.
Predictive maintenance allows teams to assess the true condition of assets before shutdown begins, ensuring time is spent where it adds value.
This can be thought about in connection to the DIPF curve, which shows how faults develop over time, from early stages through to functional failure.
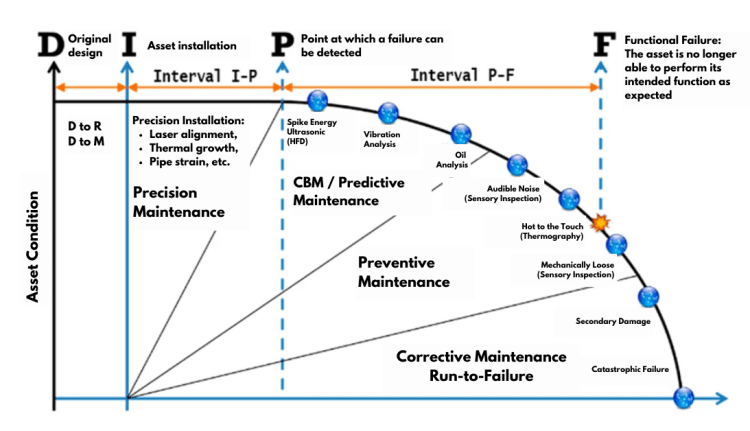
Most monitoring systems start with global indicators such as RMS velocity which are useful for highlighting when something has changed.
You might see a rise in axial vibration on a motor shaft and know that something is not quite right, but that is where the limitation begins.
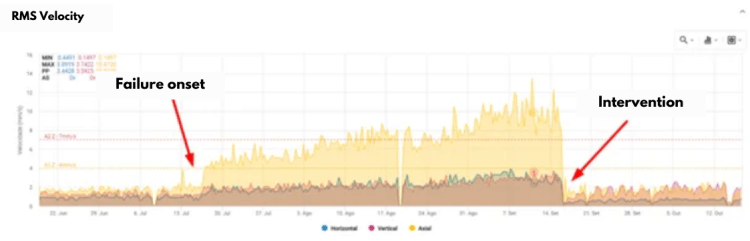
Global data tells you that a problem exists. It does not tell you what the problem is, where it is developing, or how serious it has become. To move from detection to diagnosis, you need to look inside the signal itself.
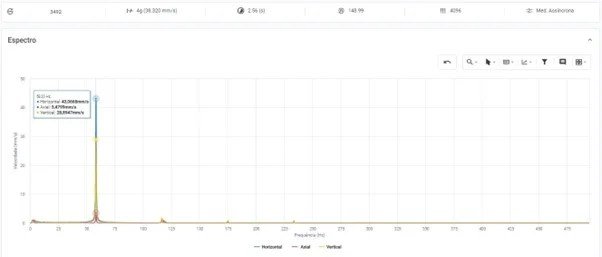
Every rotating machine produces a vibration signal made up of multiple overlapping frequencies. Spectral analysis separates that signal into its individual components, showing how vibration energy is distributed across the frequency range – and this is where things become far more useful.
Because different mechanical faults influence different parts of the spectrum, once you understand how those patterns appear, the data stops being abstract and starts becoming diagnostic.
Unbalance is often the simplest place to start.
Consider a motor operating close to 3600 RPM that began to show increasing vibration levels. When the spectral data was reviewed, a clear peak appeared at the machine’s rotational frequency.
The vibration was strongest in the horizontal and vertical directions, with very little activity in the axial axis. That combination is a well-established indicator of unbalance.
What made this particularly useful was not just identifying the issue, but seeing how it developed. By looking at the spectral cascade over time, the progression of the fault became visible, allowing maintenance to be planned rather than rushed.
Misalignment can easily be mistaken for unbalance if you are only looking at overall vibration levels, but in the spectrum, it behaves differently. Instead of a dominant peak at rotational speed, there is often stronger activity at twice that frequency.
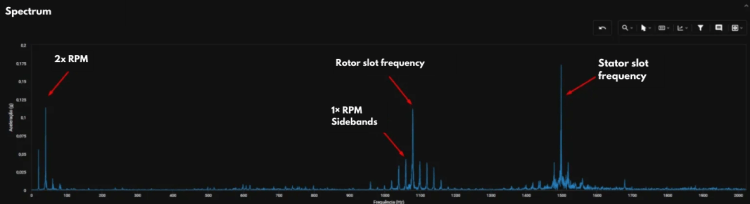
In the example shown, a clear peak at approximately 2× RPM pointed directly to parallel misalignment on the drive shaft.
Additional features, such as excitation linked to rotor and stator frequencies, helped reinforce the diagnosis.
This is where spectral analysis becomes particularly valuable, as it removes ambiguity and allows faults that look similar on the surface to be clearly distinguished.
Gearbox issues introduce more complex patterns.When a gear tooth begins to crack or degrade, the spectrum does not simply show a single peak, it reveals harmonics of the gear mesh frequency, along with sidebands linked to shaft rotation.
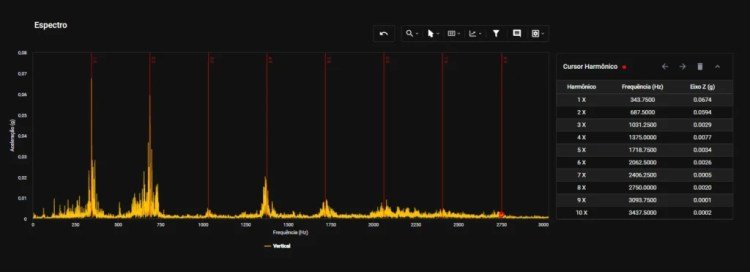
In the example provided, harmonic markers identified a base frequency at 343.75 Hz, while the spacing of sidebands at 5.08 Hz confirmed that the issue was linked to the output shaft.
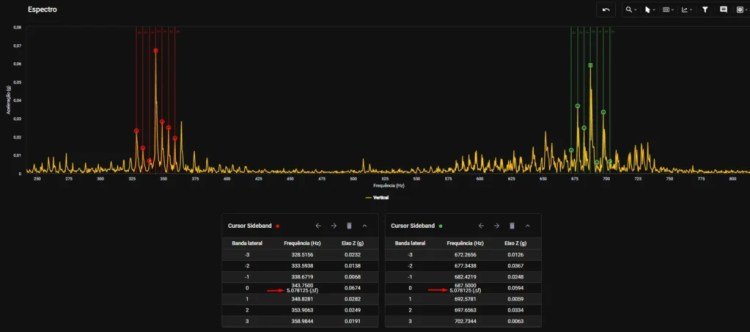
This level of detail allows the fault to be located within the gearbox itself, rather than simply identifying that something is wrong.
Not every fault presents itself cleanly.
Bearing defects, particularly in early stages, can be masked by other vibration sources. In these situations, the standard spectrum may show activity, but not enough clarity to confirm a diagnosis. This is where more advanced techniques come into play.
Envelope analysis focuses on high-frequency signals generated by small impacts within the bearing. By filtering the signal and analysing the resulting envelope, it becomes possible to isolate these impact events and reveal fault frequencies that would otherwise remain hidden.
In the example shown, the standard spectrum did not clearly indicate a bearing issue.
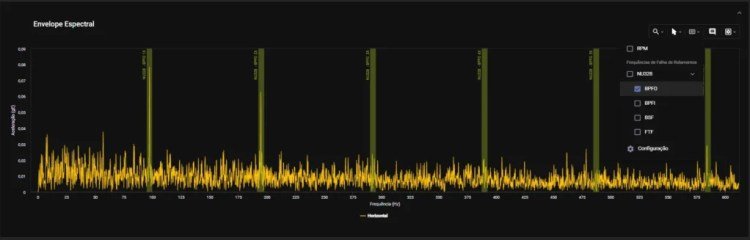
Once envelope analysis was applied, harmonics corresponding to the outer race defect became visible – this is often the difference between identifying a problem early and discovering it after damage has already occurred.
Even the best analysis will fall short if the data itself is not collected correctly and spectral accuracy depends on selecting the right sampling frequency, to ensure the dynamic range matches the asset, and captures enough data to provide resolution in the spectrum.
If these parameters are not aligned with the machine and fault type, important details can be missed or misinterpreted.
In practice, this is often where systems fall down, not because the technology is lacking, but because the setup does not reflect the application.
Historically, this level of analysis required specialist tools and manual data collection, limiting its use to critical assets, but the Dynamox system has changed that through its wireless sensors.
By allowing continuous collection of both global and spectral data, and making it accessible through a single platform, detailed analysis becomes part of everyday maintenance rather than a specialist task, meaning the same level of insight can be applied across any motor, gearbox, pump and conveyor – not just the most critical machines.
The real value of spectral analysis is not in the data itself, but in what the insights it provides mean in practice.
When maintenance teams can see exactly what is happening inside a machine, they can make better decisions, prioritising work based on actual condition, plan interventions during outages and shutdowns, and avoid both unnecessary maintenance and unexpected failures.
This is what shifts maintenance from reactive to controlled and brings a tangible difference to a business.
If you are preparing for a planned outage, understanding asset condition in detail is essential and it’s clear that spectral analysis provides the level of insight needed to act with confidence, ensuring time is spent where it delivers the greatest impact.
If you would like to explore how this approach could be applied across your plant, get in touch.